# Training Trend
You can check your weekly training volume for the past 12 weeks and your current body condition based on the Performance Management Chart (PMC).
## Weekly Training Summary
Hovering over or clicking on a specific week in the chart will reveal the following details for that period:
* FTP for that week
* Weekly average RP (Rate of Perceived Exertion)
* Weekly mileage (cumulative distance)
* Weekly training load (wTSS)
Hovering over or clicking on an item below the chart lets you isolate and view only that specific data.
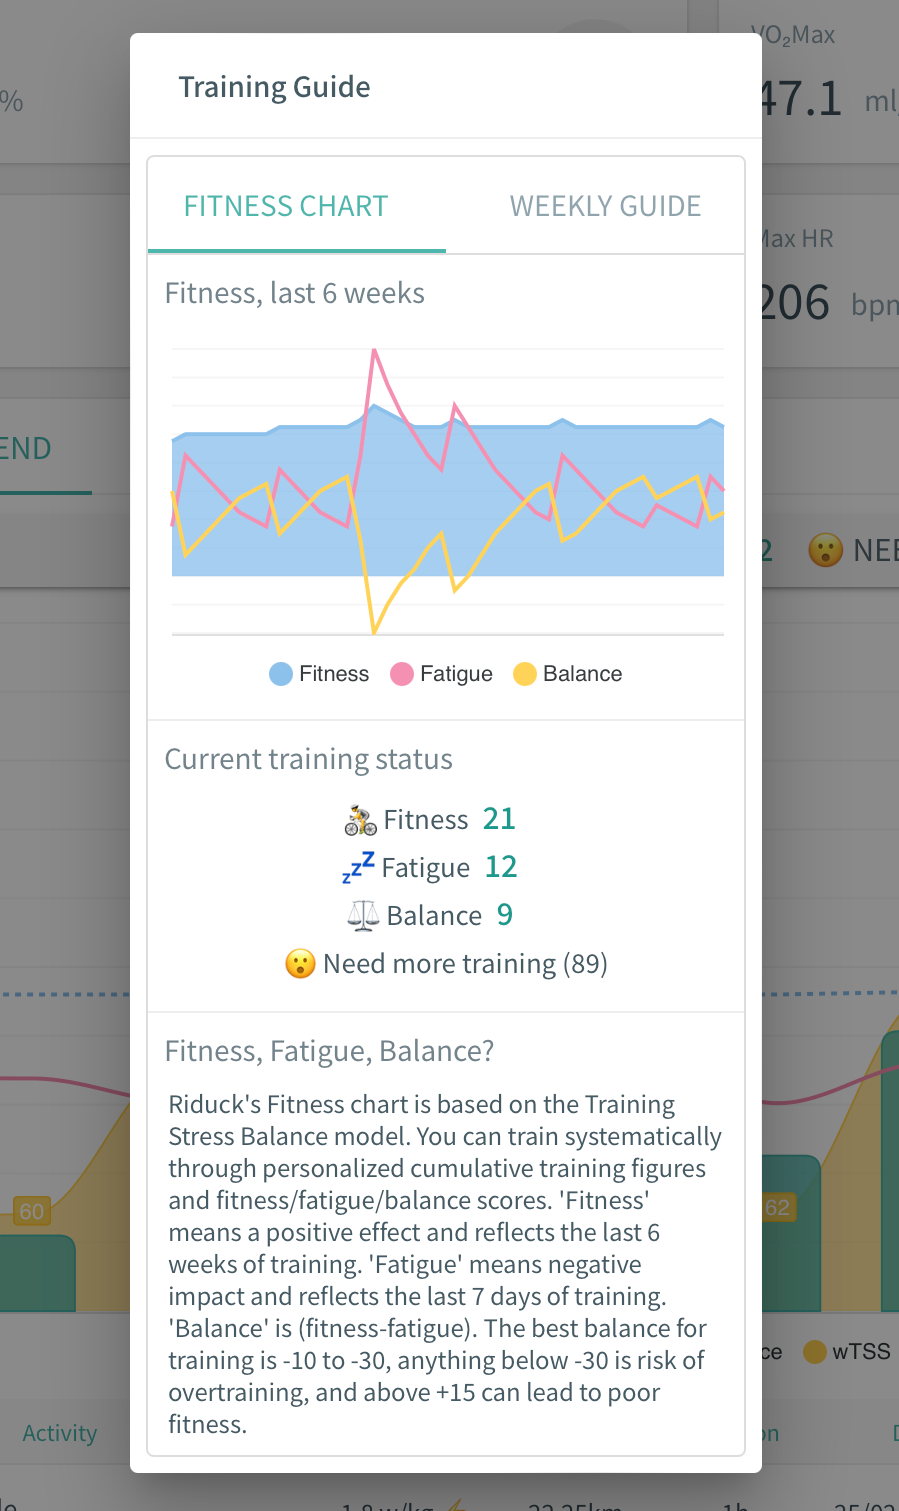
## Training Guide
Clicking the top of the chart provides access to the weekly training volume guide for managing exercise status.
{% tabs %}
{% tab title="Performance Managing" %}
It displays up to 6 weeks of stamina, fatigue, and fitness (stamina-balance) values and graphs.
For more detailed information, please refer to [performance-manage](https://riduck.gitbook.io/riduck-guide/english/browse/performance-manage "mention")
{% endtab %}
{% tab title="Weekly Training Guide" %}
You can also check the optimal wTSS value calculated by Riduck based on each rider's personal fitness to help improve your performance. Use the recommended weekly training volume as a helpful guide while monitoring your physical condition.
{% endtab %}
{% endtabs %}
## Viewing Detailed Riding Activity Data
Select a specific riding activity from the list below to view detailed data for that ride.
For descriptions of activity details, please refer to the document below:
* View All Activities - Activity Data Analysis - Comprehensive Training
{% hint style="info" %}
To return to the weekly training data view, click the "X" in the top left corner of the graph to deselect the specific riding activity.
{% endhint %}
## Checking Riding Activity Analysis (Strava Activity Description)
To view the analysis (Strava Activity Description) uploaded to Strava, select a specific riding activity from the list and click the activity's name displayed at the top of the chart. To copy the displayed analysis text, simply click the copy icon below the analysis.
{% hint style="info" %}
If the analysis text is not displayed, please click the activity's gear icon on the right (cogwheel) and proceed to "Recalculate Activity" to recalculate the activity, then check again.
{% endhint %}